WinDbg is the primary tool from Microsoft to analyze memory dump files.
This is the Step-by-Step guide to Analyze Memory Dump with WinDbg.
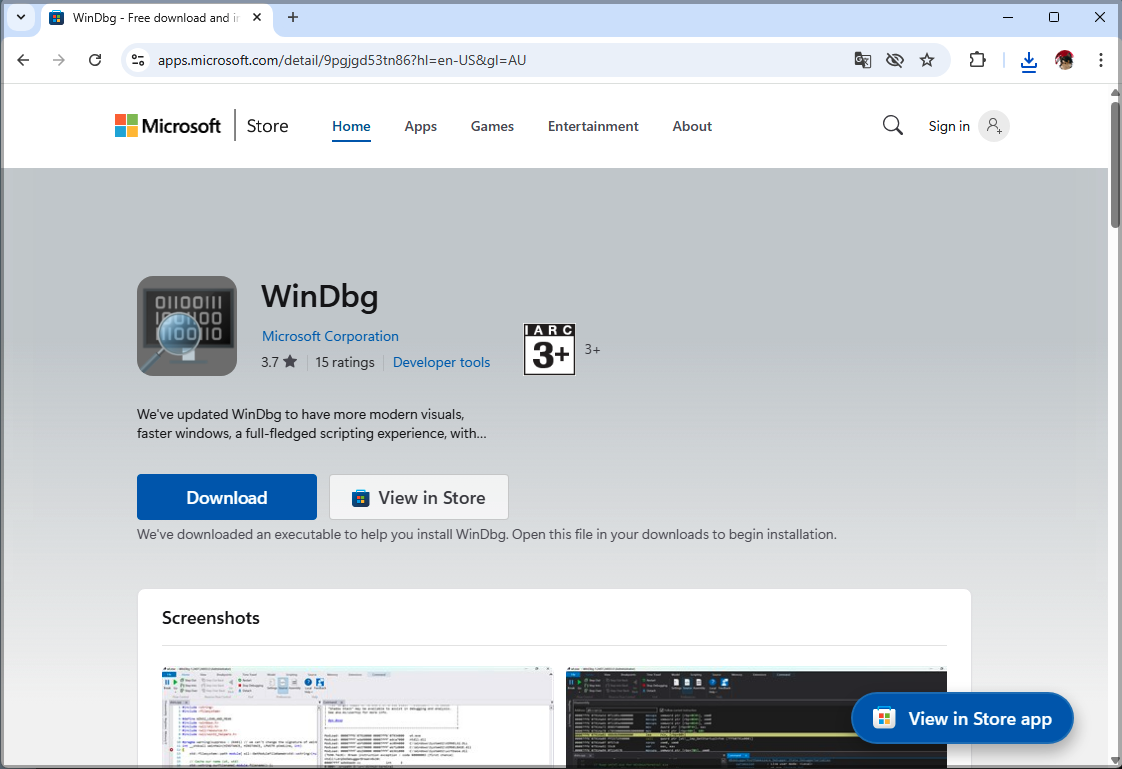
1. Install WinDbg Preview
-
Open Microsoft Store and search for WinDbg Preview.
-
Or download it from WinDbg Preview
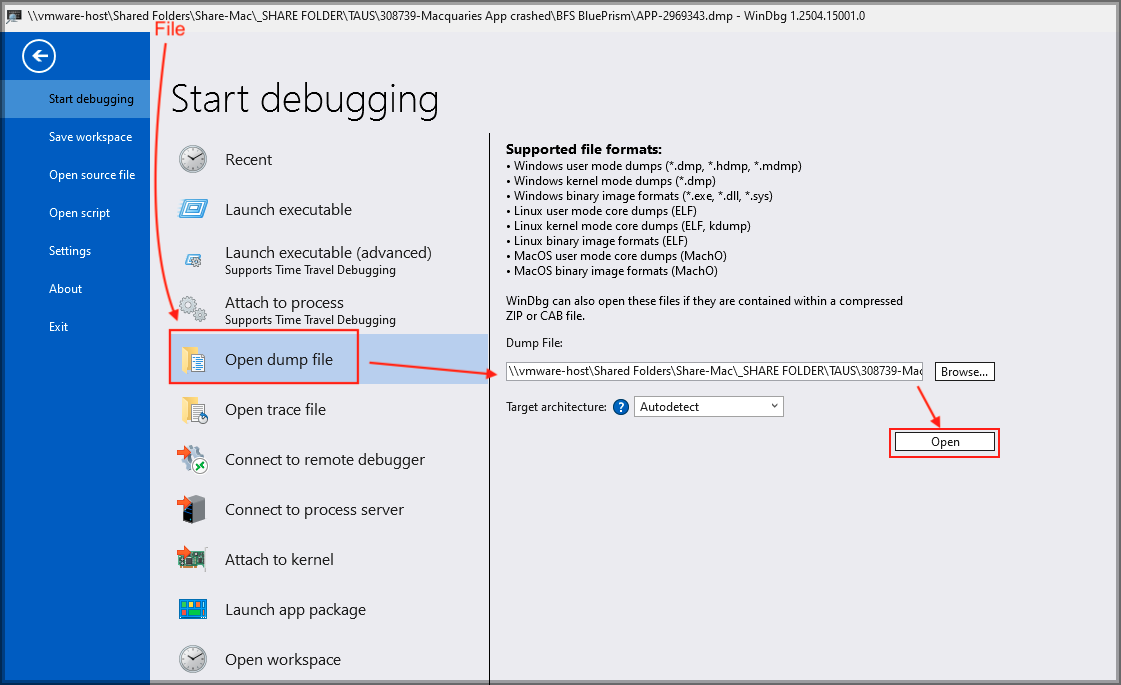
2. Open Your Dump File
-
Launch WinDbg Preview.
-
Click File > Open dump file.
-
Select your .dmp file (e.g., C:\Windows\MEMORY.DMP, C:\Windows\Minidump).
3. Use Basic Commands
- After opening the file, type the following in the command window:
!analyze -v
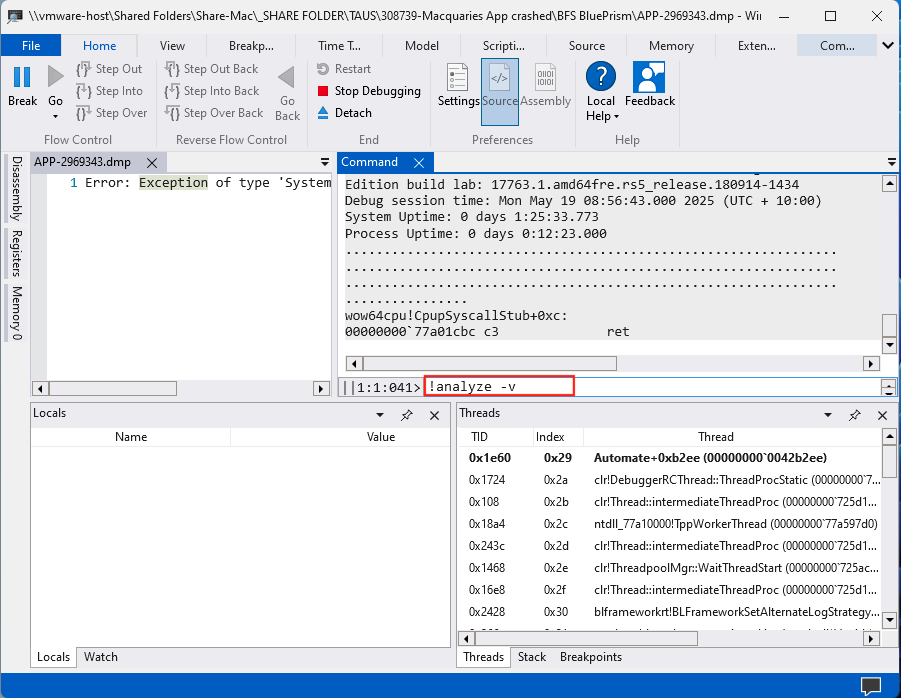
This gives a detailed analysis: crash cause, likely driver, stack trace, etc.