What is a Deadlock?
A deadlock in SQL Server occurs when two or more processes hold locks on resources and each process is waiting for the other to release its lock, causing a cycle where none can proceed.
Why Does It Occur?
Deadlocks typically hapen due to:
- Concurrent Transactions: Multiple transactions access the same resources in a conflicting order.
- Locking Order: Processes acquire locks in different sequences, leading to circular wait conditions.
- Long-Running Transactions: Holding locks for an extended period increases the chance of conflicts.
- Insufficient Indexing: Poor indexing leads to table scans, increasing lock contention.
- Blocking Issues: Heavy blocking can escalate to deadlocks if multiple processes wait indefinitely.
How Poor Maintenance Can Lead to Deadlocks
- Fragmented Indexes & Performance Degradation
- If the database has grown significantly and indexes haven’t been maintained (i.e., no reindexing or rebuilding), queries will take longer to execute.
- Longer query execution times mean locks are held for extended periods, increasing the chances of deadlocks.
- Full Logging & Large Transaction Logs
- If transaction logs are continuously growing without proper backups or truncation, SQL Server might struggle with log management, leading to slower transaction processing.
- Slow transactions hold locks for longer, making deadlocks more likely.
- Mass Deletes Without Reindexing
- Deleting a large number of records without reindexing can leave fragmented pages and inefficient query plans.
- The database engine might perform table scans instead of index seeks, leading to increased lock contention.
- Query Plan Changes (Due to Increased Data Size)
- As the database grows, SQL Server might generate different execution plans that were not optimized for the current data size.
- This can lead to more locking and blocking, increasing the chance of deadlocks.
Demo - Create a test table
1. Create a Large Table & Insert Sample Data
USE master;
GO
CREATE DATABASE ConflictTestDB;
GO
USE ConflictTestDB;
GO

CREATE TABLE Orders (
    OrderID INT IDENTITY(1,1) PRIMARY KEY,
    CustomerID INT,
    OrderDate DATETIME DEFAULT GETDATE(),
    OrderAmount DECIMAL(10,2),
    Status VARCHAR(20)
);
GO

-- Insert ~1 Million Rows
SET NOCOUNT ON;
DECLARE @i INT = 1;
BEGIN TRAN
WHILE @i <= 1000000
BEGIN
    INSERT INTO Orders (CustomerID, OrderAmount, Status)
    VALUES (ABS(CHECKSUM(NEWID())) % 1000, RAND() * 1000, 'Pending');
    SET @i = @i + 1;
END
COMMIT TRAN;
GO
2. Create Index Fragmentation (Without Reindexing)
-- Delete a large number of records randomly to cause index fragmentation
DELETE FROM Orders WHERE OrderID % 10 = 0;
GO

-- Fill gaps with new inserts (in random order)
SET NOCOUNT ON;
DECLARE @i INT = 1;
BEGIN TRAN
WHILE @i <= 100000
BEGIN
    INSERT INTO Orders (CustomerID, OrderAmount, Status)
    VALUES (ABS(CHECKSUM(NEWID())) % 1000, RAND() * 1000, 'Pending');
    SET @i = @i + 1;
END
COMMIT TRAN;
GO
3. Check Fragmentation for All Indexes on [Orders] Table
SELECT
    index_id,
    index_type_desc,
    avg_fragmentation_in_percent,
    avg_page_space_used_in_percent,
    page_count
FROM sys.dm_db_index_physical_stats(DB_ID(), OBJECT_ID('Orders'), NULL, NULL, 'LIMITED');
avg_fragmentation_in_percent → Shows fragmentation level:
- 0-10% → Good
- 10-30% → Consider reorganizing
- 30%+ → Consider rebuilding
4. [OPTIONAL] Disable Auto Update Statistics (Causes Poor Query Plans)
ALTER DATABASE ConflictTestDB SET AUTO_UPDATE_STATISTICS OFF;
GO
If disabled, manually update statistics using:
UPDATE STATISTICS Orders;
or
EXEC sp_updatestats;
What Are Statistics in SQL Server?
Statistics help SQL Server’s query optimizer decide how to execute queries efficiently. They store distribution details about table data, like:
- Number of distinct values
- Data distribution
- Index selectivity
SQL Server automatically updates statistics when:
- A significant amount of data changes (inserts, updates, deletes).
- A query execution detects outdated statistics.
Demo - Create a Deadlock in the Test Table
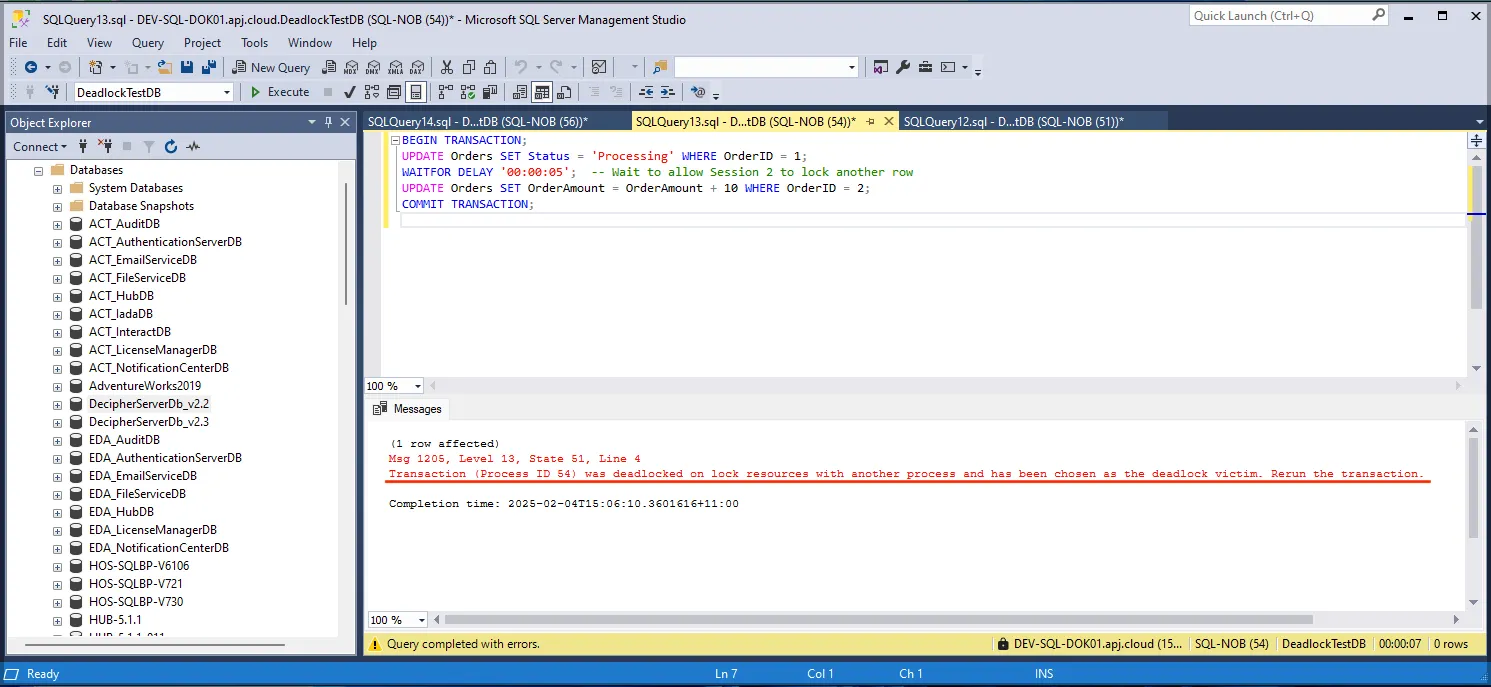
1. Run Session 1 (Query Window 1)
BEGIN TRANSACTION;
UPDATE Orders SET Status = 'Processed by Query1' WHERE OrderID = 1;
WAITFOR DELAY '00:00:05';  -- Wait to allow Session 2 to lock another row
UPDATE Orders SET OrderAmount = OrderAmount + 10 WHERE OrderID = 2;
COMMIT TRANSACTION;
2. Run Session 2 (Query Window 2)
BEGIN TRANSACTION;
UPDATE Orders SET OrderAmount = OrderAmount + 10 WHERE OrderID = 2;
WAITFOR DELAY '00:00:05';  -- Wait to allow Session 1 to lock another row
UPDATE Orders SET Status = 'Processed by Query2' WHERE OrderID = 1;
COMMIT TRANSACTION;
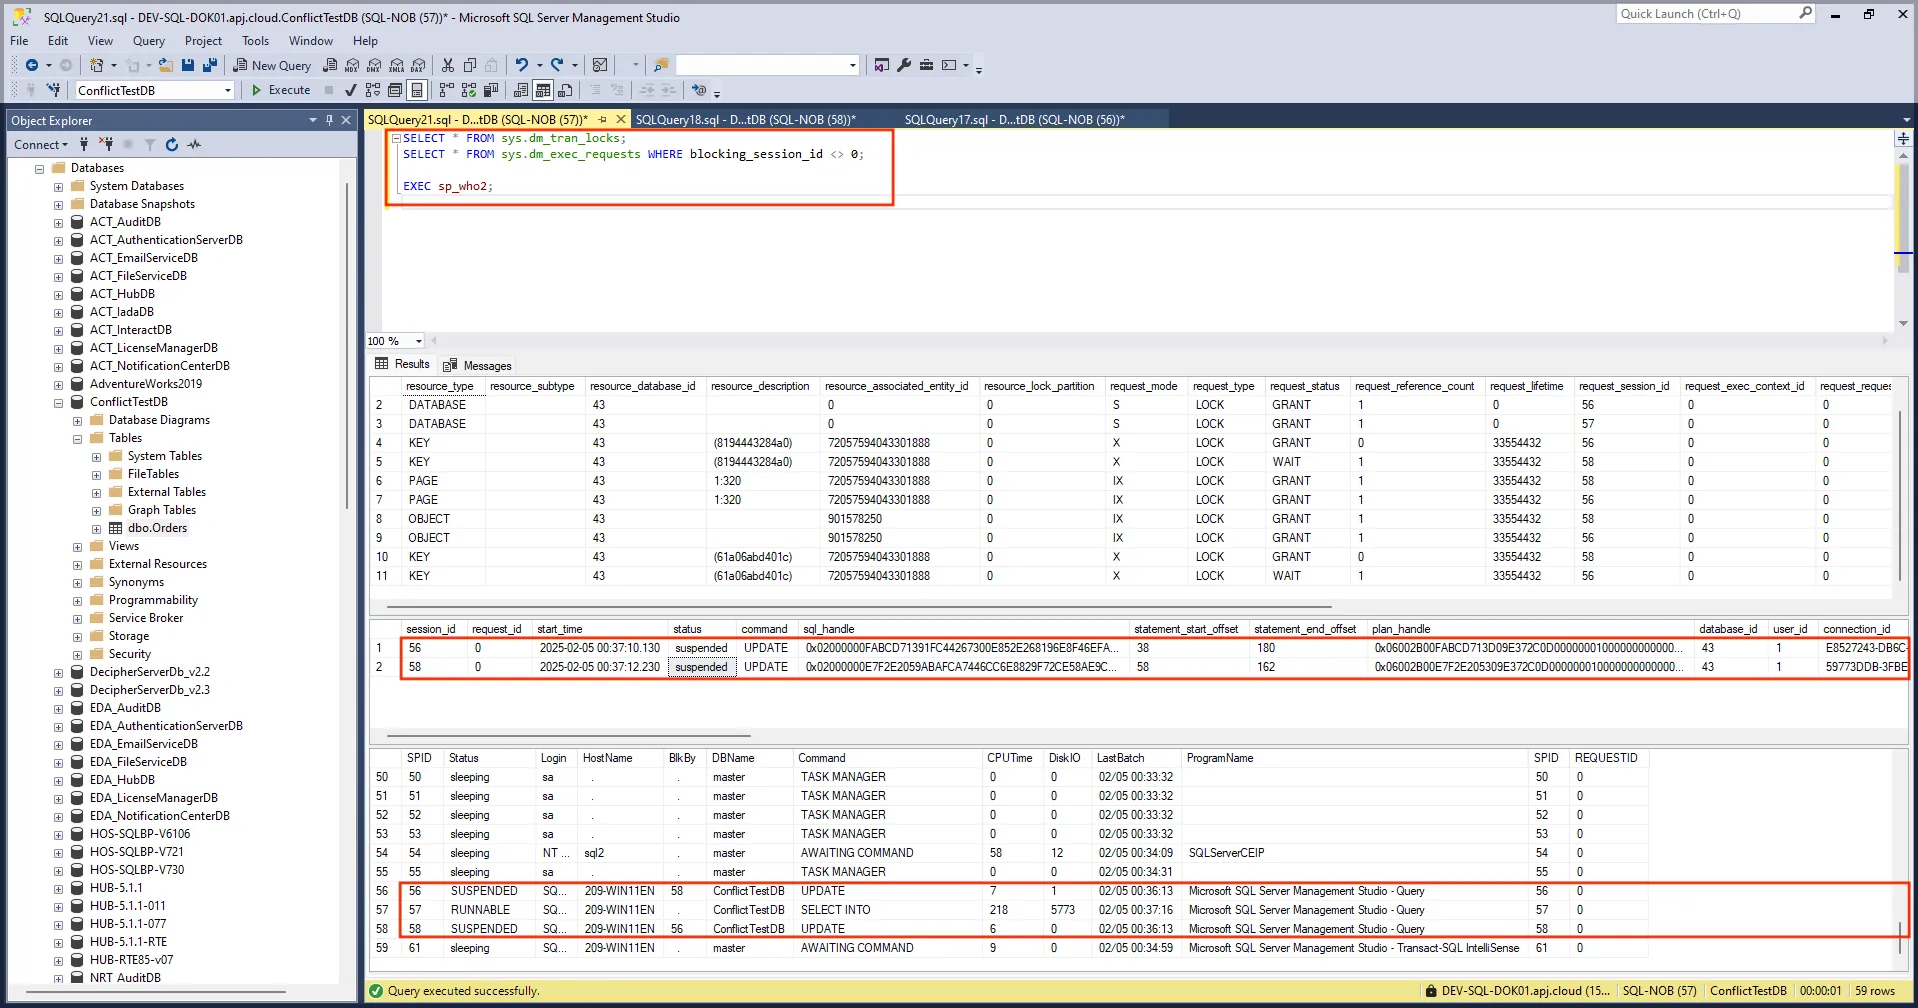
3. Run the queries quickly to check the current status
SELECT * FROM sys.dm_tran_locks;
SELECT * FROM sys.dm_exec_requests WHERE blocking_session_id <> 0;
EXEC sp_who2;
4. It throws a deadlock error
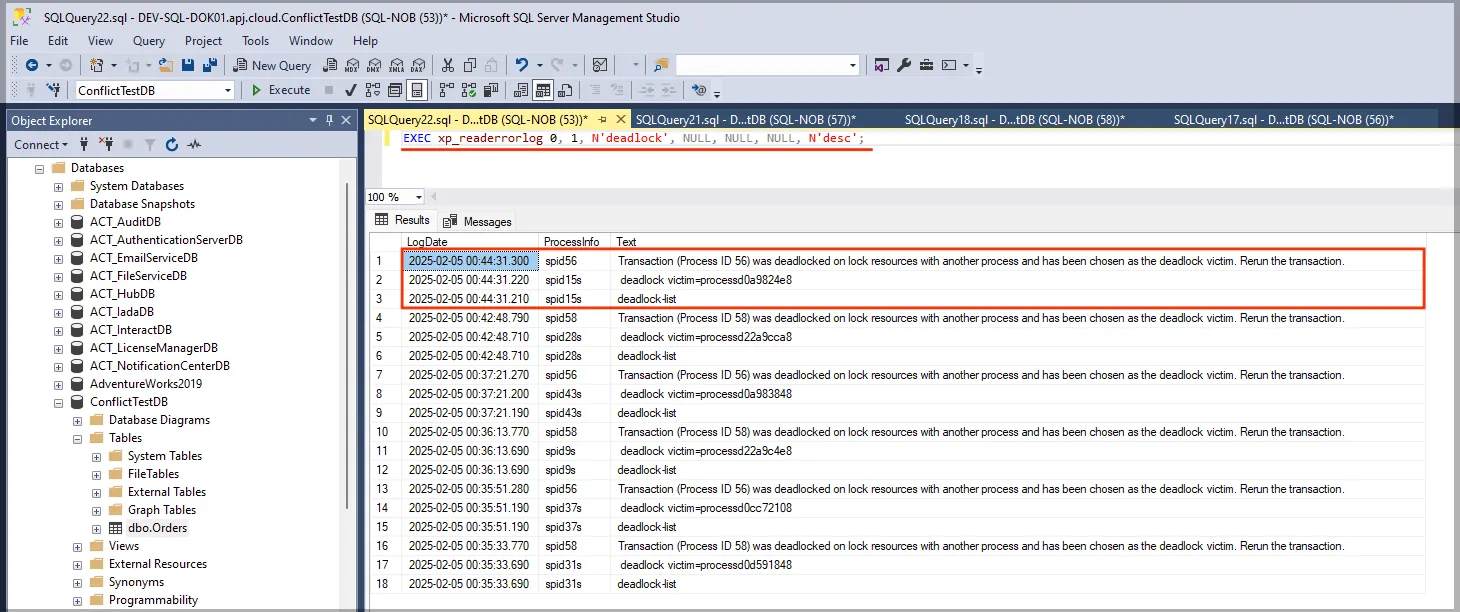
5. Check the event in the log
This query below will return entries related to deadlocks from the SQL Server error log, including the process IDs involved, the time when the deadlock occurred, and details about the resource involved in the deadlock.
EXEC xp_readerrorlog 0, 1, N'deadlock', NULL, NULL, NULL, N'desc';
How Page Count Relates to Performance:
- Large Tables/Indexes: Tables with many rows or wide rows (containing many columns) will have more pages. SQL queries on these large tables may require more disk reads and thus could be slower unless cached in memory.
- Buffer Pool: The more pages SQL Server can keep in memory, the faster the performance. SQL Server will try to cache frequently used pages in memory (buffer pool). If a table or index fits entirely in memory, it will perform faster than if it needs to be read from disk.
How to fix fragmentation?
- Reorganize index (for 10-30% fragmentation)
ALTER INDEX ALL ON Orders REORGANIZE;
- Reorganize index (for 30%+ fragmentation)
ALTER INDEX ALL ON Orders REBUILD;
Next Steps
The steps to address the potential causes of deadlocks, especially related to database fragmentation and log table management.
1. Check Fragmentation of the Log Table
- Script: It helps in understanding how inefficiently space is used. High fragmentation means more I/O operations to read and write data.
SELECT
    index_id,
    index_type_desc,
    avg_fragmentation_in_percent,
    avg_page_space_used_in_percent,
    page_count
FROM sys.dm_db_index_physical_stats(DB_ID(), OBJECT_ID('log'), NULL, NULL, 'LIMITED');||
2. Write Down avg_fragmentation_in_percent and page_count
- Pay particular attention to the
avg_fragmentation_in_percent— fragmentation above 30-40% could significantly impact performance.
3. Remove Old Logs and Rebuild Index
- Log Cleanup: Before rebuilding, ensure you’ve purged any old logs that are no longer necessary. This will help reduce the overall size and improve performance.
- Reindexing: REBUILD can take time, especially with a table as large as 300GB, and may impact performance temporarily. Ensure you schedule this during a maintenance window or when there’s minimal database load.
Single Table
ALTER INDEX ALL ON BPASessionLog_NonUnicode REBUILD;
Multiple Tables (Sample 1)
DECLARE @TablesToRebuild TABLE (TableName NVARCHAR(255));

-- Add only the tables you want to rebuild
INSERT INTO @TablesToRebuild (TableName)
VALUES
    ('BPASession'),
    ('BPASessionLog_NonUnicode'),
    ('BPASessionLog_Unicode')

DECLARE @TableName NVARCHAR(255);
DECLARE TableCursor CURSOR FOR
SELECT TableName FROM @TablesToRebuild;

OPEN TableCursor;
FETCH NEXT FROM TableCursor INTO @TableName;

WHILE @@FETCH_STATUS = 0
BEGIN
    PRINT 'Rebuilding indexes on table: ' + @TableName;
    EXEC('ALTER INDEX ALL ON ' + @TableName + ' REBUILD;');
    FETCH NEXT FROM TableCursor INTO @TableName;
END

CLOSE TableCursor;
DEALLOCATE TableCursor;
Multiple Tables (Sample 2)
DECLARE @sql NVARCHAR(MAX) = '';

SELECT @sql += 'ALTER INDEX ALL ON [' + TableName + '] REBUILD;' + CHAR(13)
FROM (VALUES
    ('BPASession'),
    ('BPASessionLog_NonUnicode'),
    ('BPASessionLog_Unicode')
) AS TableList(TableName);

PRINT @sql;
EXEC sp_executesql @sql;
4. Monitor and Compare Results
- After the cleanup and reindexing, you should expect a reduction in fragmentation. Monitoring this can help you determine if fragmentation was contributing to the deadlocks.
5. Monitor the System After Changes
- Deadlock Monitoring: Check if any schedule failure due to deadlock issue.
- Performance Monitoring: Monitor CPU, I/O, and memory performance using tools like SQL Server Management Studio (SSMS) to ensure the server is not overloaded.
6. Other Considerations
- Log File Size: If the log file has grown too large (beyond what is necessary for normal operation), advise the customer to shrink and reindex it.